SO1. Achieve full understanding of diver behaviour through interpretation of both conscious (symbolic hand gestures) and unconscious (pose, physiological indicators) nonverbal communication cues.

SO1.a. Develop efficient and near real-time algorithms for diver pose estimation and gesture recognition based on acoustic and visual conceptualization data obtained in a dynamic and unstructured underwater environment.
During the first two years of the project the following advances have been made with respect to this subobjective:
- algorithms for hand gesture recognition using stereo camera imagery
- algorithms for hand detection using multibeam sonar imagery
- algorithms for diver pose recognition and localization from mono and stereo imagery
- algorithms for diver pose and localization recognition using the sonar imagery
The first bulletpoint has proven to be the most efficient in real experiments hence this approach was chosen as the most robust one. Pose recognition using sonar imagery is chosen for determining the position of the diver, used afterwards in cooperative control between the surface vehicle, the underwater vehicle and the diver. A summary of the main methods developed for each task with the different sensors during whole projects is presented as follows.
Diver hand gesture recognition
The stereo-image based method relies mainly on a feature aggregation algorithm developed to cope with the highly variant underwater imagery: Multiple-Descriptor Nearest Class-Mean Forest (MD-NCMF). The main idea behind this, is that different image descriptors are robust against different type of distortions; thus, by aggregating their information without compressing them, a classifier can be made more robust and accurate. However, 3D information generated from the stereo images is used to create saliency areas to locate the hands, as well as Haar-cascade classifiers; then the classification of the gesture is done using only 2D information as shown in Fig. SO1.1. It is also important to mention that during the research and experimentation process, different QR and colour markers were tested on the diver’s gloves. Nevertheless, image quality and light attenuation prevents their use for gesture classification; on the other hand, they provide enough image texture to generate 3D information and facilitated the hand detection process.
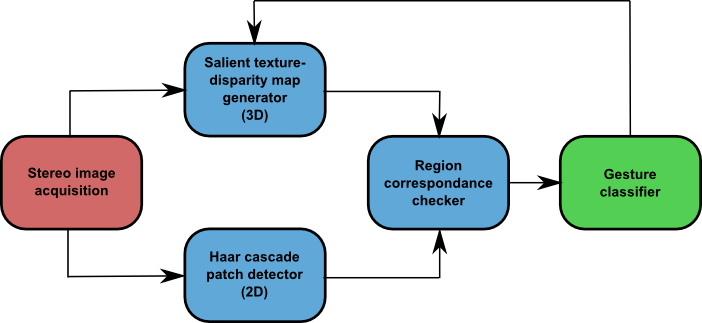
Fig. SO1.1. General framework diagram for hand gesture recognition. The different stages of the process are colour coded. (Red) Image acquisition (Blue) Hand detection (Green) Gesture Classification
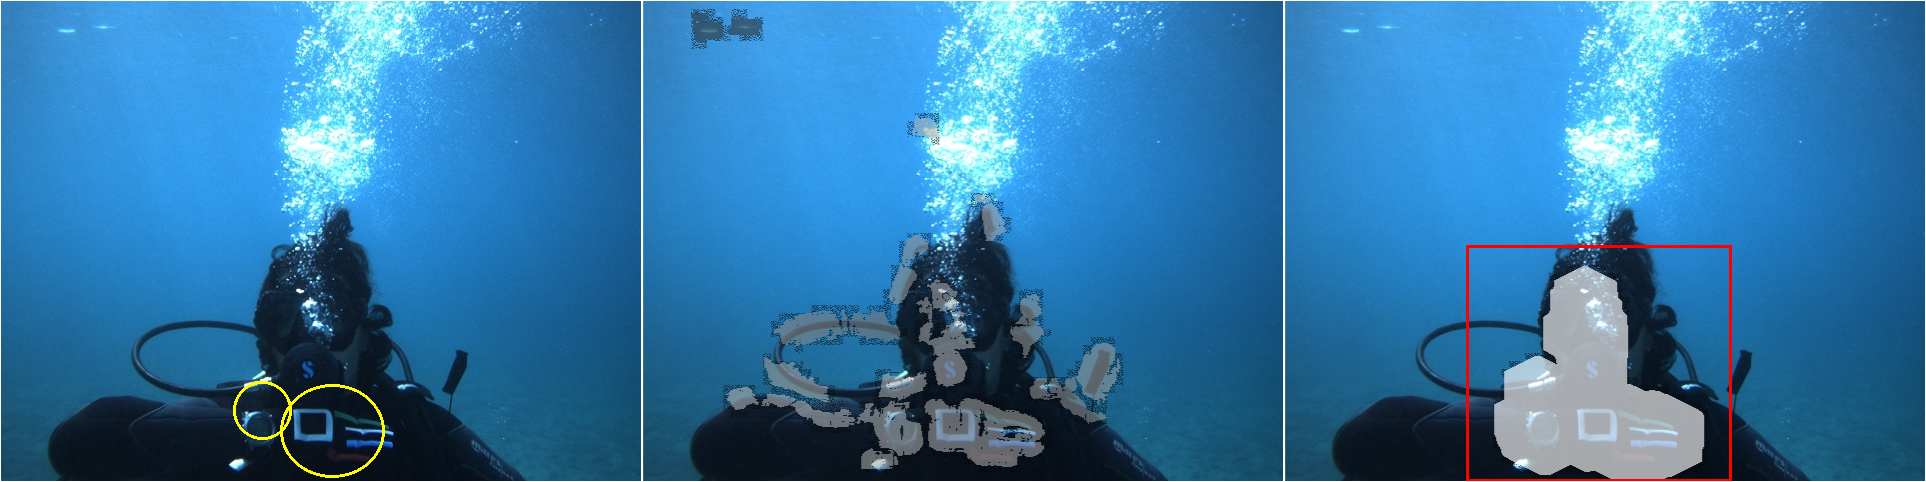
Fig. SO1.2. (Left) Hand detection using 2D features in Haar cascades (Middle) Disparity map generated from stereo camera (Right) Processed disparity map for hand detection using 3D information
Hand gesture based on sonar imagery is described as follows. Hand detection is performed using a cascade of boosted classifiers based on Haar-like features proposed by Viola and Jones. In the 1st year, this detector was only trained to detect five hand gestures containing different number of visible fingers.
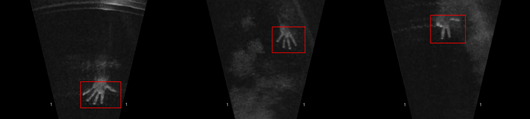
Fig. SO1.3. Three images of hand detection in sonar image using a cascade of boosted classifiers based on Haar-like features.
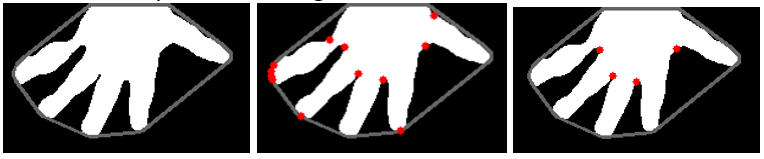
After hand detection step, area marked by cascade classifier is used for further processing and gesture recognition. Two approaches were used for gesture recognition. First, a convex hull method that uses binary thresholded image to extract the contour of the hand and calculate a convex hull around the hand, resulting in the detection of fingertips. Second, a multiclass support vector machine was used to classify five different gestures shown below.
|
|
|
Fig. SO1.4. Gesture recognition from sonar by convex hull method. Convex hull (top left); all convexity defects (top right); filtered convexity defects (bottom)
|
Both methods showed good results. By combining both the robustness increased to 98% accuracy in this 5 classes.
Diver pose recognition and localization
As stated before, the system mainly relies on sonar data to locate and follow the diver. Acoustic data presents less distortions than camera data and, opposite to the hand gesture recognition module, not such fine details are needed to recognize the diver. This also allows the AUV to keep a greater distance to the diver guaranteeing his safety; camera needs to be 3 meters or closer to the diver in order to extract useful information about his pose or behaviour.
The method based on sonar readings, thresholds the image and detects the diver contours. First, the image is blurred to smooth the sonar noise, then a binary image is created based on a user-defined threshold, setting high-value regions to white. Since the Cartesian space sonar image is used, which has a sector shape, and all the image processing algorithms work on rectangular images, the outside of the useful sonar image is coloured in neutral grey to avoid artefacts on the edge region. The detected contours are later processed to find the ones that might represent the diver.
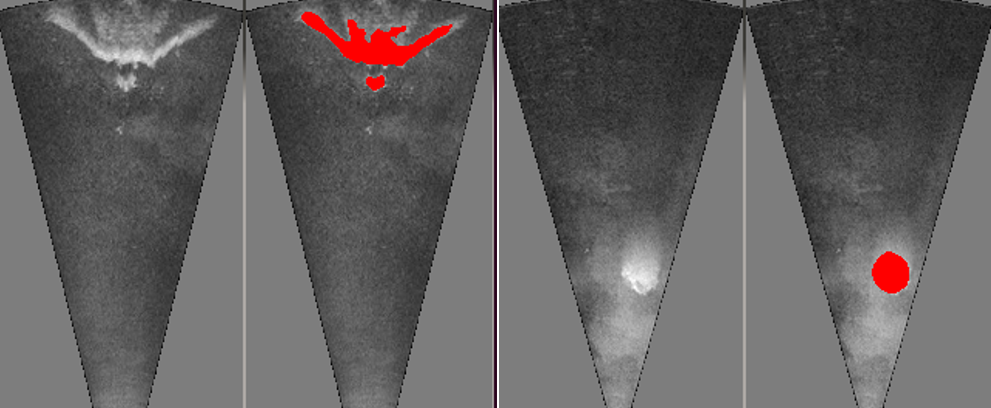
Fig. SO1.5. Detecting diver silhouette (left) and exhale bubbles (right) in sonar images.
As an integral part of the sonar pose estimation, is the diver tracking algorithm. Once the diver is detected in the sonar image, his coordinates and position relative to past frames (detection) is passed to a tracking (filter) algorithm that aggregates diver information from the sonar, the acoustic modem and the stereo camera when necessary. The purpose is to position the BUDDY vehicle precisely relative to the diver; this algorithm is explained more thoroughly in the section about cooperative control and formation keeping. It is important to have a motion tracking algorithm due to possible occlusions, other large objects in the subsea and the bubbles exerted by the diver.
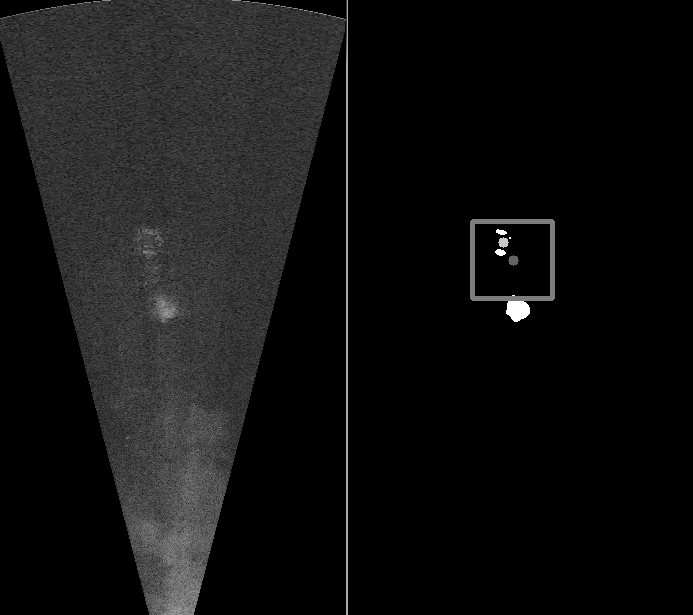
Fig. SO1.6. Region of interest in the sonar image. The estimator follows the diver instead of being stuck on the bubbles that are dominant in the image.
Diver orientation using stereo camera imagery was implemented for the purpose of doing this computation onboard the BUDDY vehicle to position the AUV relative to the diver. This in order to overcome some of the shortcomings of sonar imagery and the acoustics communication. Depending on the underwater terrain and currents, the sonar algorithm can misclassified the diver with large rocks or lose sight of the diver. And the acoustics modems can only transmit information every 5 seconds in average. The stereo image processing can help in the diver localization to corroborate the sonar information and give real time diver information.
First from the stereo images a dense disparity map is generated based on image features. In order to eliminate 3D points belonging to other objects than the diver a clustering algorithm DBSCAN that uses colour and depth is used to oversegment the diver. Then the cluster areas with small number of points are eliminated as they are considered as noise. From this processed disparity map, the final diver point cloud is generated. In this way, we ensure that PCA (principal component analysis) is applied only to the diver and not other parts of the underwater imagery. Then the PCA eigenvector are used as an input to a classifier to determine the diver orientation.
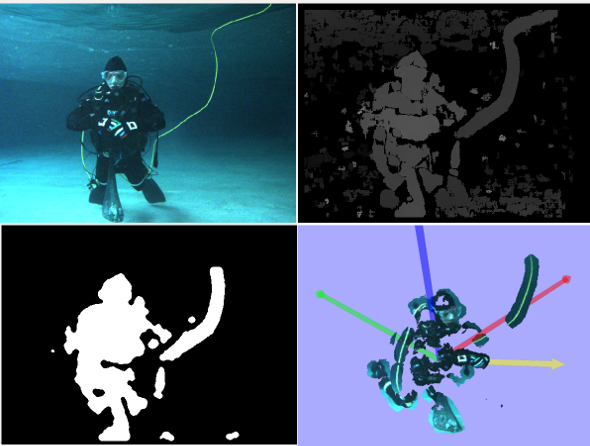
Fig. SO1.7. (Top left) One stereo image from the diver (Top right) Raw disparity map generated with DAISY descriptor (Bottom left) Generated disparity map after segmentation and filtering (Bottom right) Generated point cloud with RGB eigenvectors and diver orientation shown with yellow arrow.
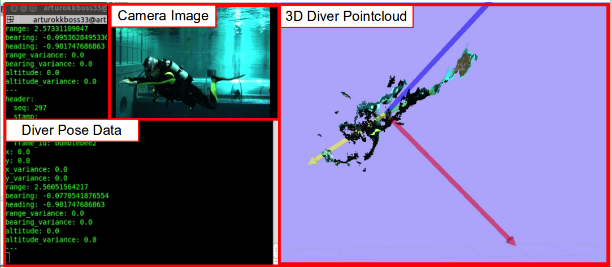
Fig. SO1.8.(Screenshot of ROS and Rviz showing the camera images, the diver’s pointcloud (top view) and the terminal displaying all important measurements about the diver’s pose.
On the test set the Extremely Randomized Forest classifier achieves 71.6% accuracy. However, as it can be seen in the figure below, the majority of the predicted headings lie within 1 or 2 bins of the true heading. So, we can state that even when the classifier outputs an incorrect value, there is a 90% probability (less than 2 bins error) that it will output a heading close enough to the true value for it to be used by the control filter.
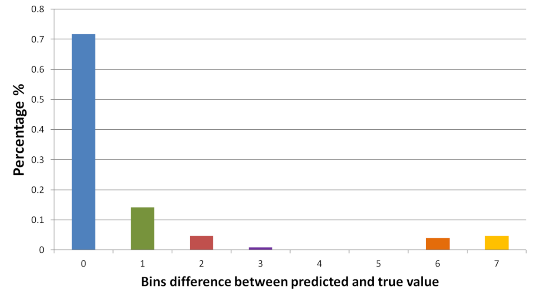
Fig. SO1.9. Graph showing the percentage of times the classifier predicted a heading with a difference of N angular bins. N=0, represents the number of times the classifier output the true heading of the diver.
A database of stereo images and point clouds for both the hand gesture recognition module and the diver pose estimation was made available online at http://robotics.jacobs-university.de/datasets/2017-underwater-stereo-dataset-v01/.
This subobjective is considered to be completed.
SO1.b. Develop adaptive algorithms for interpretation of diver behaviour based on nonverbal communication cues (diver posture and motion) and physiological measurements.
Two major achievement were made with respect to this subobjective: automatic diver activity classification and detection of diver states.
Automatic activity classification
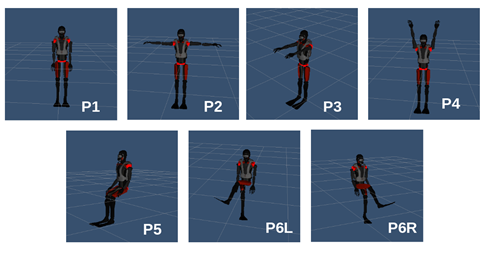
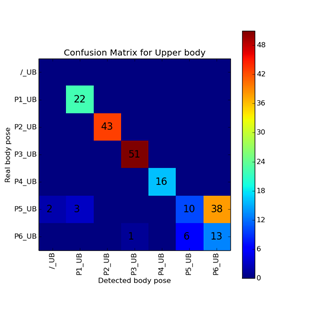
The reconstructed diver posture obtained from DiverNet is used for automatic activity classification, where the system would know what the diver is doing even without a human operator observing. We tested the dynamic time warping algorithm and artificial neural network. Tests were conducted with 7 poses. The results of activity classification are summarized using the confusion matrix below.
|
|
|
|
Fig. SO1.10. Poses used in initial classification tests with Dynamic time warping
|
Fig. SO1.11. Confusion matrix for Dynamic time warping tests
|
Diver behaviour interpretation
We developed multilayer perceptrons for diver behaviour interpretation using emotion, motion and physiological data collected in dry land and diver experiments.
We showed as a proof of concept that it is possible to determine experienced emotional states from body motions captured with DiverNet motion sensors.
Although the information is present in breathing motions – the primary source which gives much better results are body motions. Using body motions for prediction is not only possible in walking behaviour but also for a diver swimming underwater. Thus produced motion is a basic predictor for experienced emotion. As far as we know there is no scientific report on this relation up to now. Another highlight is the categorization of behaviour categories from body motions. In addition we developed a real time analysis program which plays back dive recordings and analyses them.
Data collection and dynamic features of time series
We investigated relations between motion, emotion and physiology in five dry experiments to prove the concept of predicting emotions based on physiology and motion patterns as well as to develop and test the time series features needed to achieve the final diver behaviour interpretation algorithm. The dry land experimental results showed that emotion prediction based on motion breathing motion and heart rate is possible. As a result of these experiments, we developed a number of time series features for prediction of emotional states and decided on the Mehrabian-Russel approach of Pleasure-Arousal-Dominance/Control for emotion prediction.
To extend our findings to divers, we conducted four diver experiments in the Y-40 pool. The final validation of the diver algorithms was done with the validation data set collected in Biograd in a more natural setting. Experimental data collections in Y-40 yielded data from 45 divers and the validation experiment in Biograd led to another 14 diver data sets.
Depending on the analysis, the actual number for specific analyses may differ because of technical problems in single dives. In all data collections, divers were asked to perform typical underwater tasks which were coded for the diver behaviour data base.
Another problem we tried to solve is data reduction of the time series. Time series have specific dynamic features that usually get lost in machine learning. Thus we developed a procedure that extracts time series dynamics. Breath rate and heart rate were calculated based on the original data streams and the motion rate was calculated for the upper and the lower body as well as the entire body. To calculate dynamic features, we considered overlapping 35 second windows of the time series. A peak detection algorithm finds peaks in the time series windows, based on which further parameters of the time series data can be calculated: amplitude, amplitude_on, amplitude_off, curve length, speed, speed_on, speed_off and turbulence (see D.3.4.)
Development of Diver Behaviour Interpretation Algorithms
The dynamic features described above were fed into machine learning algorithms. This data reduction approach was quite successful for the prediction of Pleasure, Arousal and Dominance/Control when fed to a multilayer perceptron. As the multilayer perceptrons achieved more accurate predictions than tested TDNNs, we used multilayer perceptrons for the final analyses.
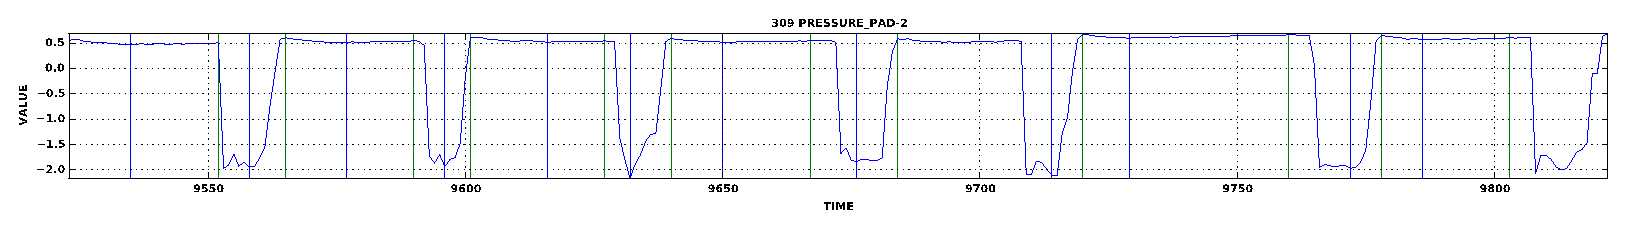
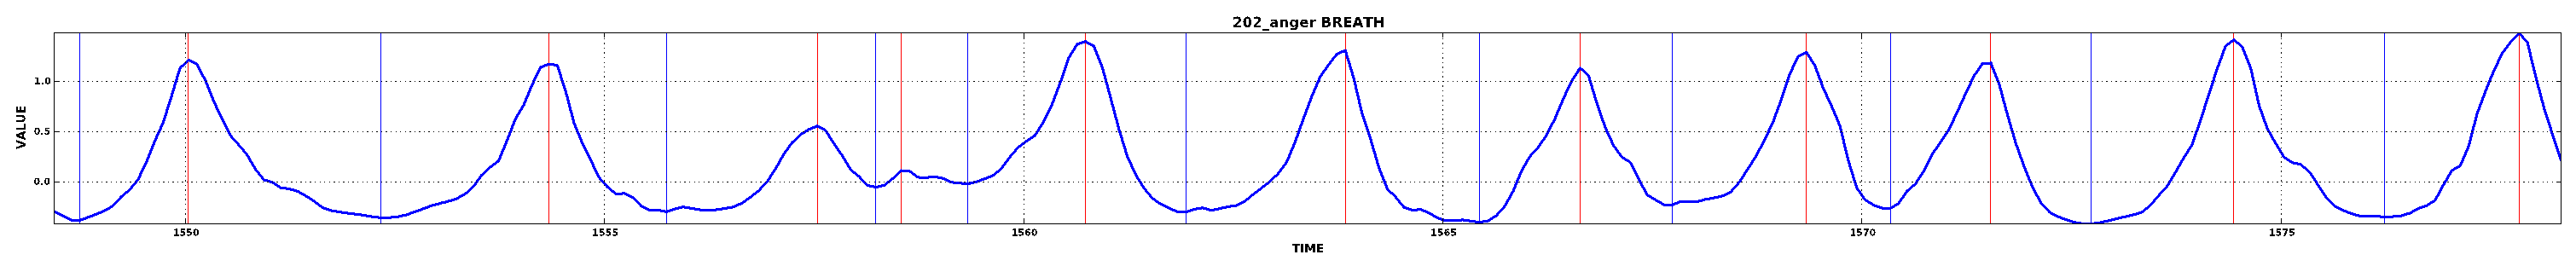
Fig. SO1.12. Raw breathing curves from different sensors: pressure sensor (upper), breathing belt (lower). Pressure sensors have much less fine details in breathing behaviour. The sensor difference is the reason we cannot use the breathing curves from the experiments in the further analysis of divers – we only can use rates. Rates are calculated from the peak distances.
We analysed the time series from both dry land and underwater experiments using breath and/or heart rate as well as motion rate (if available) to predict pleasure, arousal and control with multilayer perceptron and achieved comparable results for all settings. In total, 287 motion data sequences from dives in Y-40 were used for the training of the networks. We based our predictions on the 35 second window prior to the collection of emotion data
As input data we used the ten dynamic features for breath rate, heart rate and motion rate (n=130 learning data, n=56 testing data). The perceptron thus had 30 input units and a layer of 20 hidden units, nine output units for pleasure, arousal and dominance (each high, neutral and negative). The activation rule was TanH.
|
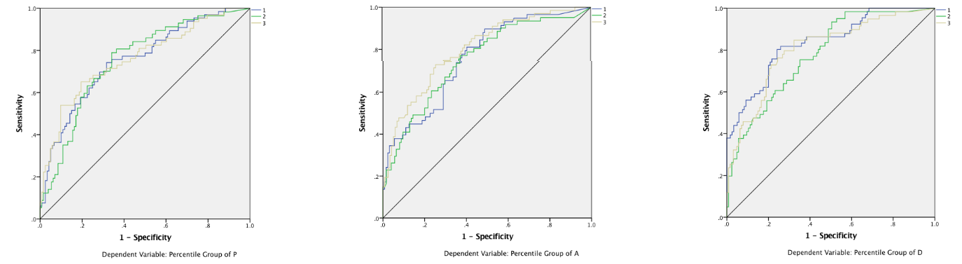
Fig. SO1.13. ROC curves showing the performance of decisions in the MLP for pleasure, arousal and dominance (1=high, 2=neutral, 3 = negative). They clearly exceed chance rate.
|
We searched for optimal networks by varying learning algorithms with randomized number of hidden layers and units and used fold approaches where the training and testing data are selected randomly and used to test new networks to find the optimal network and assess the real performance. The classification rates are as follows: Pleasure (49%), Arousal (43%), and Dominance/Control (43%). Classification was always highest for the correct classification category.
We redid our analysis after recursive feature elimination to reduce the number of variables and attained comparable success rates for the Y-40 dataset.
|
|
Pleasure: (meas. motion rate, turbulence, amplitude, curve length)
|
Arousal: (meas. motion rate, amplitude on/off, speed, Nr. of minima)
|
Dominance: (measured motion rate, turbulence, speed_on, speed_off, Nr. of minima)
|
|
Trials 1
|
0,54
|
0,46
|
0,46
|
|
Trials 2
|
0,59
|
0,19
|
0,66
|
Validation of Diver Behaviour Interpretation Algorithm
We validated the algorithm resulting from the recursive feature elimination in the Biograd diver data set which contained 36 motion data sequences.
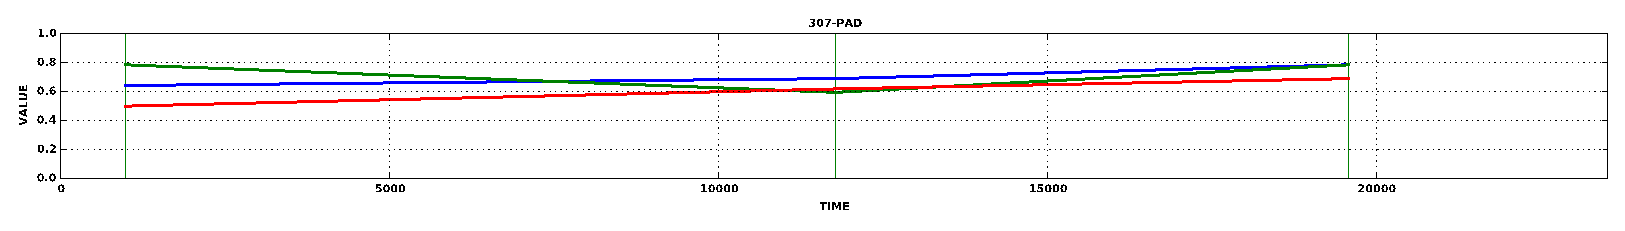
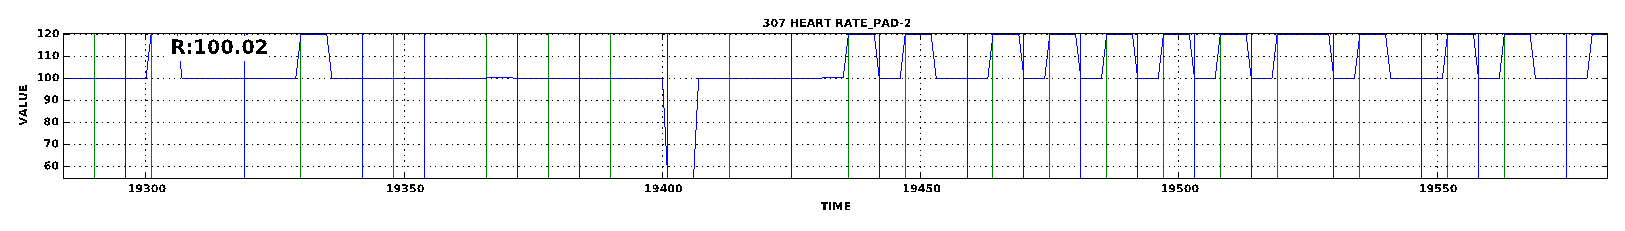
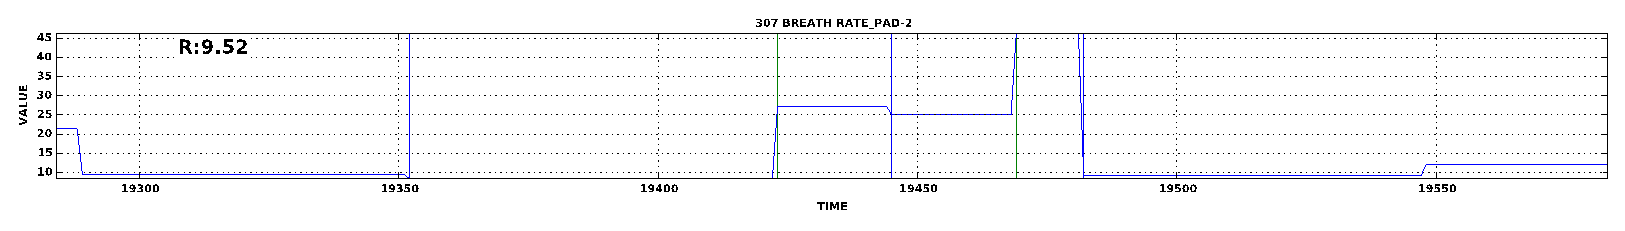
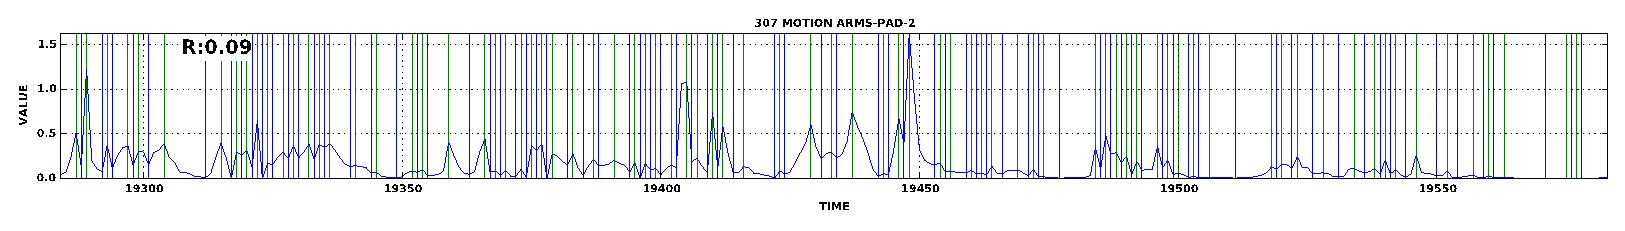
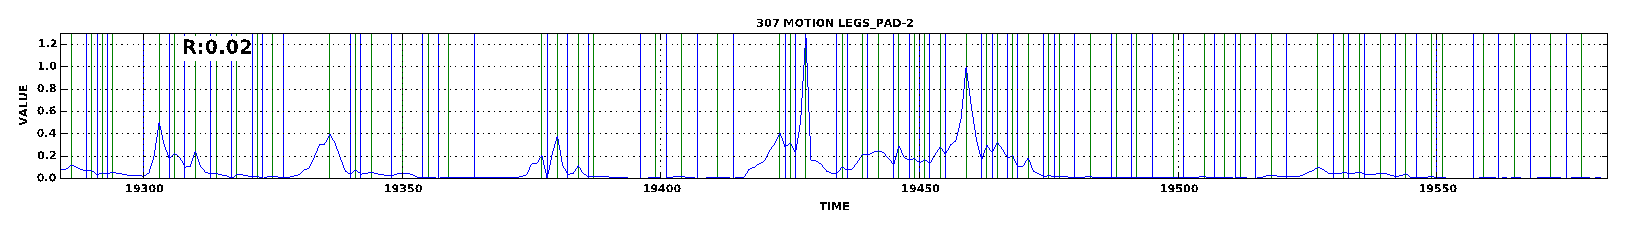
Fig. SO1.14. Raw data from an experiment in Padua. The top graph shows the pleasure (green), arousal (blue) and dominance/control (red) values during the experiment. These values stem from a principal components analysis from the 18 items questionnaire. The divers filled out three questionnaires underwater on the tablet. The other four graphs depict a 30 second window (heart rate, breathing rate, motion rate, motion rate arms, and motion rate legs) collected before filling out questionnaire two.
Real Time Behaviour Recognition Algorithm
As final proof of concept we implemented a real time behaviour recognition algorithm in the DiverControlCenter. We tried to categorize diver behaviour into ‘diver manipulating some object’ or ‘swimming freely’. This is necessary because a diver does not show paddling motion when manipulating objects and this might be mistaken as diver inactivity. In order to do so we used the diver behaviour catalogue. This catalogue has 23 different behaviour codes (overall n=1790 coded behaviours) coded for all dives (n=59).
We exported all behaviour data from the diving experiments from the start of a behaviour code plus 30 seconds. In this window the dynamic variables were calculated for upper and lower body motion from DiverNet separately. In next step we carried out a visual inspection of exported movies so that it was clear that for instance coded ‘Working on Tablet’ actually contained ‘Working on Tablet’. Then we created two categories: ‘Object Manipulation’ (n=981) which consisted of ‘Working on Tablet`, and ‘Swimming’ (n=205) which consisted of ‘Swim left-right slow’, ‘ ‘Swim left-right fast, ‘Swim Up-Down’ and ‘Swim Free’.
The dynamic descriptors for the thirty seconds were used to train a Multilayer perceptron. The overall efficiency of the network was 0.85 which is fairly high. The correct recognition of ‘Object manipulation’ was =0.92 and for ‘Swimming’ the network reached 0.61. Visual inspection of the movies shows that the reason for this lower efficiency lies in the fact that divers had to turn around in order to swim from left to right – which causes a pause in their swimming behaviour.
The result is that we can recognize in real time if the diver is manipulating an object or swimming. The network has been implemented in the DiverControlCenter program where they give back the probabilities of swimming or object manipulation in real time.
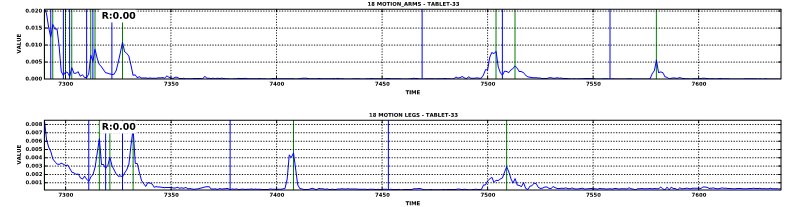
Motion of arms and legs during object manipulation
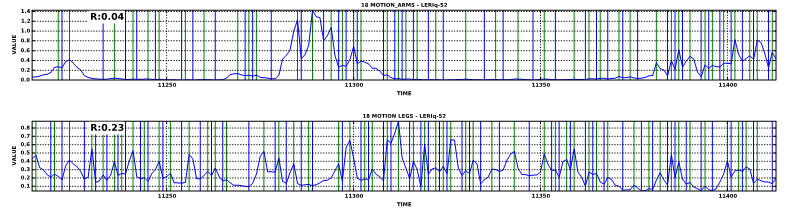
Fig. SO1.15. Motion of arms and legs during swimming
DiverControlCenter
The emotion and behaviour predicting multilayer perceptrons were implemented in our real time playback application DiverControl. This shows that it is possible to do the classification in real time but it also outlines that under the poor visibility conditions the DiverNet data can be used to monitor the diver in real time.
The flowchart (Fig. SO1.16.) depicts the final implementation we suggest for a diver control program: There are three main data sources (heart rate, breath rate and motion rate). All three data streams have the basic dynamic features calculated over a 30 second window. These data are fed into the respective MLP.
The determination of risk from heart rate and breathing is not trivial, because both depend on the age of the diver and the task. The most promising approach is to have a thirty second breathing and heart rate recording at the beginning of the dive under resting conditions and then determine the outliers as a function of the mean and the standard deviation of the resting period.
Fig. SO1.16. Flowchart of suggested control parameters and variables for diver control. The flowchart outlines the procedures which are necessary to monitor the diver. We have implemented heart rate and heart rate anomaly based on age data, the same is done for breath rates. Red light depict abnormal rates. We also used motion rates in this system and pleasure, arousal, dominance/control values from the neural network. We plan to implement a Fuzzy logic module for decision making if the diver mission is critical or not.
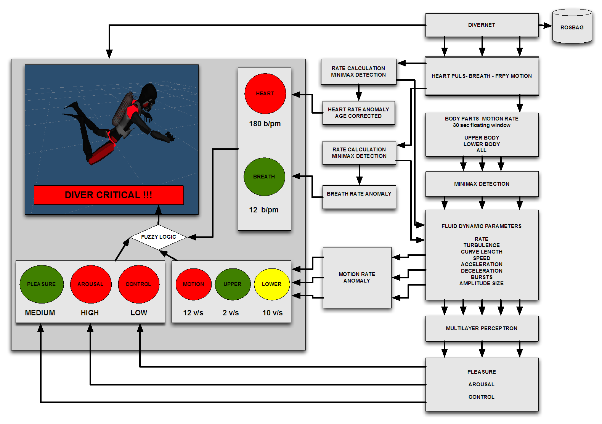
Fig. SO1.16. Flowchart of suggested control parameters and variables for diver control. The flowchart outlines the procedures which are necessary to monitor the diver. We have implemented heart rate and heart rate anomaly based on age data, the same is done for breath rates. Red light depict abnormal rates. We also used motion rates in this system and pleasure, arousal, dominance/control values from the neural network. We plan to implement a Fuzzy logic module for decision making if the diver mission is critical or not.
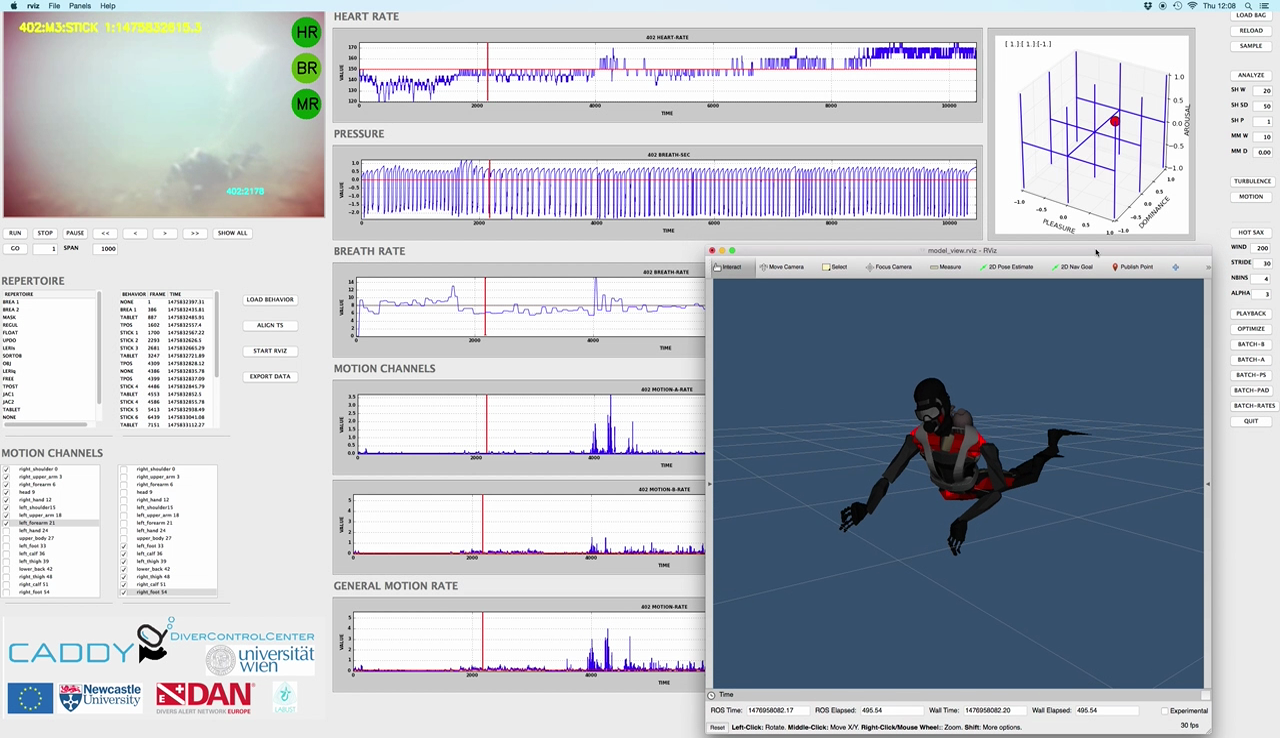
Fig. SO1.17. DiverControl Center depicting a real time playback of the Biograd Experiments: The predicted diver’s emotional state is shown on the upper right.