TO2. Establishing a robust and flexible underwater sensing network with reliable data distribution, and sensors capable of estimating the diver pose and hand gestures.

TO2.a. Testing and evaluation of sensors that will enable pose estimation and hand gesture identification in the underwater enviroment
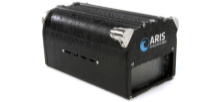
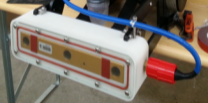
Remote sensing technologies such as high resolution ARIS multibeam sonar, stereo camera, and mono camera were tested to evaluate their applicability for diver recognition. The high resolution multibeam sonar can detect diver hands but it is mainly used to detect the diver at larger distances (>3 meters) and his global pose (direction). A stereo camera housing with flat tempered glass has been custom built to reduce image distortions caused by the common cylindrical housing. Additionally, DiverNet a network of inertial measurement units distributed on the diver's body to monitor his behaviour and vital signals was designed and tested.
|
|
|
|
Fig. TO2.1 (a) High-resolution ARIS multibeam sonar.
|
(b) Stereo camera in a custom underwater case.
|
A more in detailed description if each of these sensors and technologies is shown as follows.
Underwater stereo camera and housing: stereo calibration underwater is notoriously difficult for two reasons: 1) The air-glass-water interface acts as an additional lens in the best case, and negates the usual pinhole camera assumption in the worst case. 2) Difficult lighting conditions and attenuation make collecting good calibration data difficult. Instead of calibrating underwater directly, a technique was developed to estimate the underwater calibration parameters based on the much easier and well understood in-air calibration and basic measurements of the underwater housing used. The proposed technique is shown to work well for monocular images as well as for use in a practical stereo setup underwater. The stereo camera system is mainly used in the hand gesture recognition module and diver pose estimation as is described in other sections of the document.
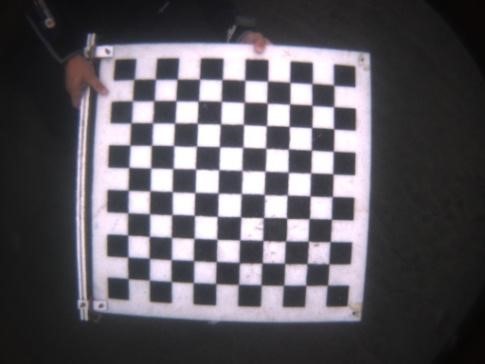
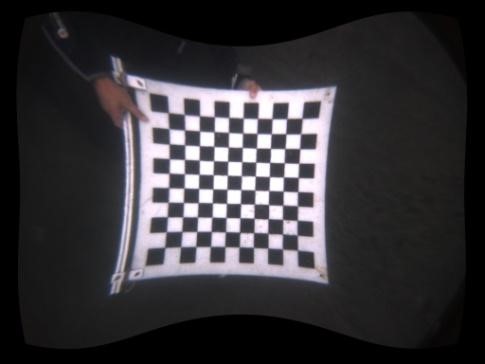
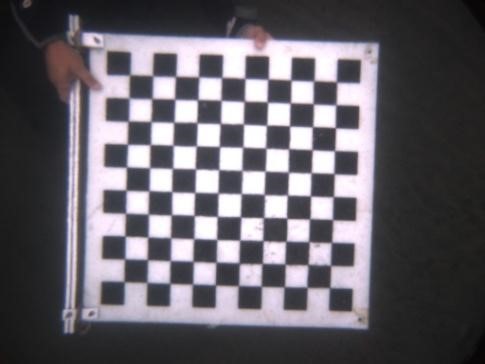
Fig. TO2.2. Underwater Camera Intrinsics from Physical Refraction Model (Left) Original image (Middle) Undistortion process based on in-air calibration, only refractive distortion remains (Right) Undistortion process based on approximated in-water distortion coefficients.
DiverNet: This is a custom designed and manufactured network of inertial sensors (IMU) and physiological sensors that are mounted on the diver in order to reconstruct the pose of the diver and classify their health/emotional state. This is the first time that such a system has been successfully demonstrated underwater. Custom visualization software has also been developed including a real time animation of the diver. On top of the main DiverNet hub hardware design and software integration of the sensors, the following functionalities were added:
- Wireless transmission of DiverNet data has been developed using an acoustic modem to the surface. Also, local data processing is implemented on the tablet so that only high-level measurements are transmitted to the surface and minimise transmission time.
- Software has been augmented with a calibration method consisting of the diver assuming a "T" pose that is used for calibration of sensors.
- Heart rate and breathing sensors have been integrated with the DiverNet, allowing monitoring of breathing patterns and heart rate measurement via a wireless receiver.
DAN Europe also studied the feasibility of integration of intelligent clothes for monitoring respiration and the heart rate. A market survey revealed only 4 biometric t-shirts available in the market for breathing and heart rate monitoring. Samples of t-shirts were purchased from Hexoskin, Ralph Lauren, OM Signal and Athos. A series of experiments to measure breathing and heart rate on land at rest, during bicycle riding and underwater were performed with 16 volunteers (8 males, 8 females). The integration of such biometric clothing with DiverNet is only possible for Divers using Dry Suit. Integration will be possible where producers will provide an SDK for third parties, with the company most amenable to this approach being OMSignal.
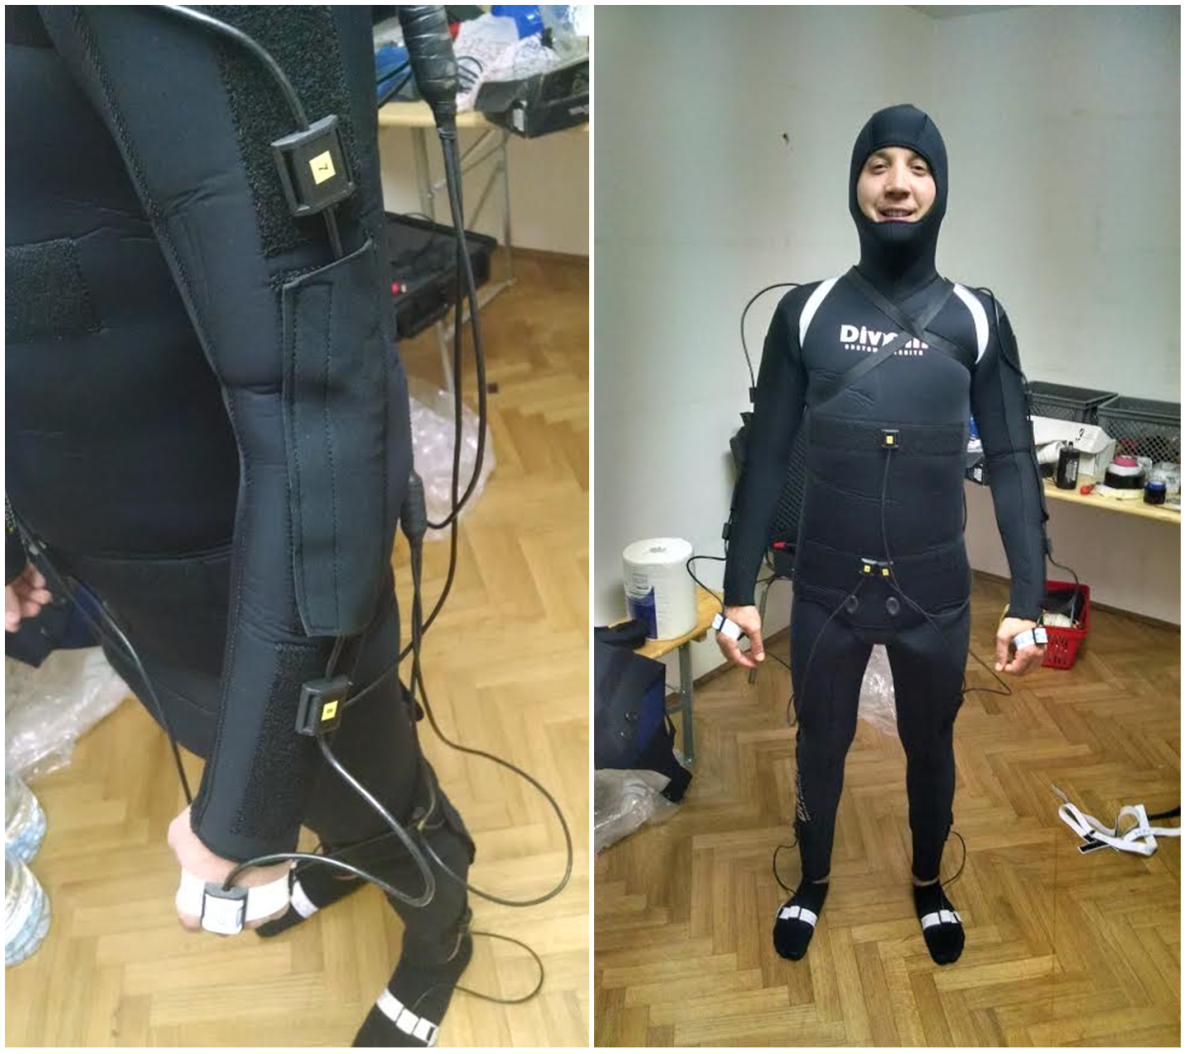
Fig. TO2.3. Final version of DiverNet mounted on diver´s suit.
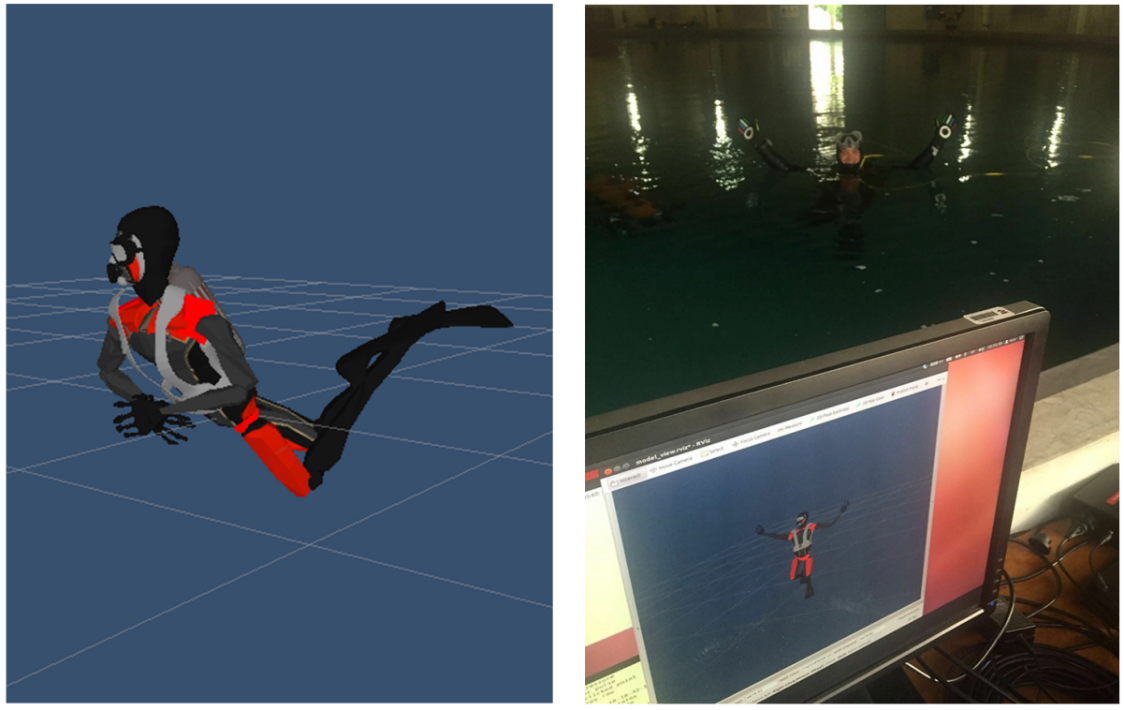
Fig. TO2.4. (Left) Diver model - stickman – displayed in ROS Rviz simulation environment. (Right) Diver in background and simulation reproducing his movements on land wirelessly.
The DiverNet was fully integrated with the diver tablet and a Seatrac acoustic modem during both validation trials, enabling motion and physiological data to be processed on board the tablet and key metrics to be transmitted to the BUDDY vehicle and/or the surface. Figure TO2.5 shows an example where the motion sensors on the diver’s feet have been analysed to extract padding rate on the left and right flippers. This parameter is then transmitted periodically to the surface and displayed. The result shows the diver paddling steadily for periods at various different rates, interspersed with periods of treading water. Around 95% data delivery was achieved over this period with most drop outs due to masking of the acoustic transducer by the diver’s body.
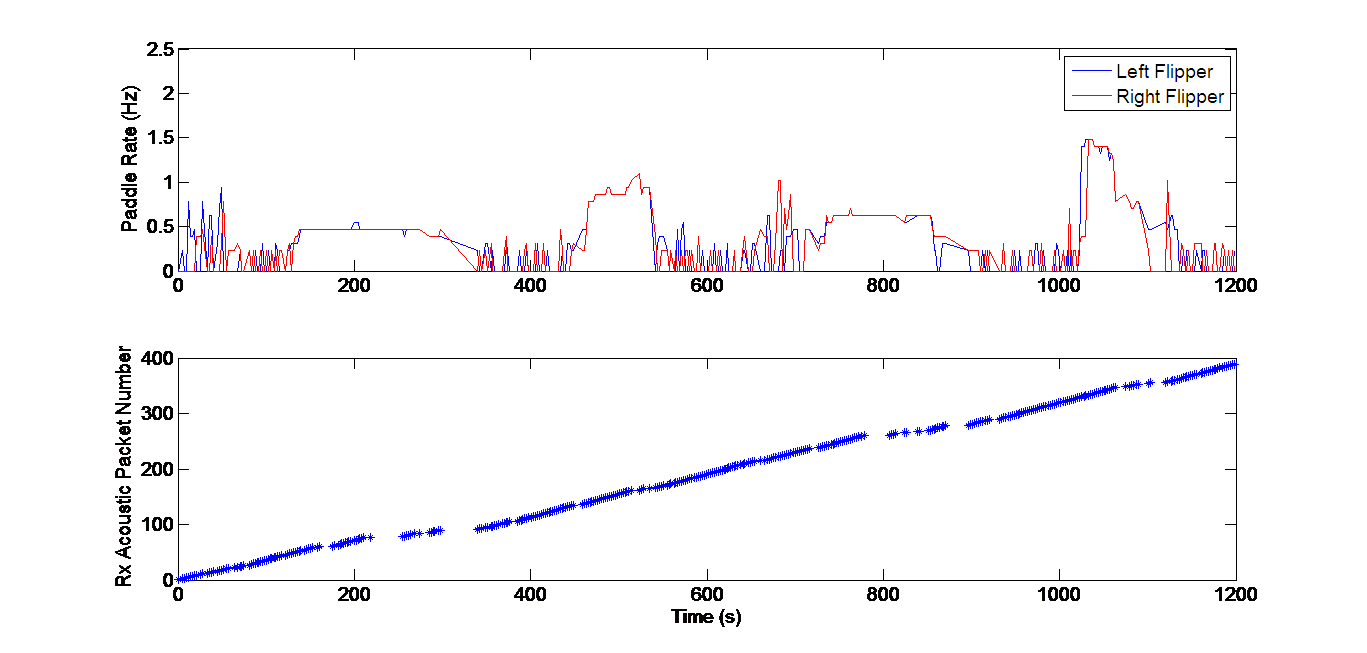
Fig. TO2.5. An example of wireless transmission of DiverNet data. The top plot shows the frequency of paddling measured by the inertial sensors on the diver flippers. The bottom plot shows the regularity of acoustic packet reception at the surface. These data were obtained during validation trials where anomalies such as different paddling rates between two flippers (indicating e.g. a lost flipper) were easily detected from the surface.
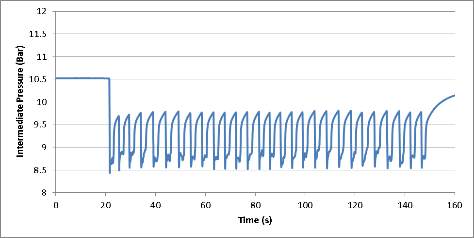
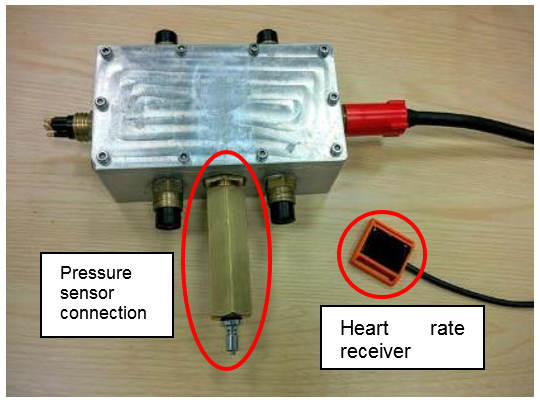
A piezoelectric breathing belt sensor proved to be unreliable during the 1st validation trials, it being impossible to accurately distinguish breathing from other upper body muscle activity on a diver. For this reason UNEW worked with DAN Europe to investigate the feasibility of using a pressure sensor on the intermediate pressure leg of the diver’s breathing apparatus. This proved to be a more robust sensing mechanism, providing very clear signals (such as in Figure TO2.6) from which the breathing rate can be extracted by simple processing algorithms. The compromise is that this signal may not enable the more detailed analysis of breathing patterns possible with sensors that reveal the depth of breathing as well as rate. A digital pressure sensor with pneumatic hose interface was designed and constructed and integrated with the DiverNet hub (Fig. TO2.7).
|
|
|
|
Fig. TO2.6. Typical output from intermediate pressure sensor to measure diver breathing pattern
|
Fig. TO2.7. DiverNet hub with pressure sensor and wireless heart rate receiver
|
TO2.b. Propagation of the acquired data through the network to each agent with strong emphasis on securing reliable data transmission to the command centre for the purpose of automatic report generation and timely reporting in hazardous situations.
New acoustic models and USBL positioning
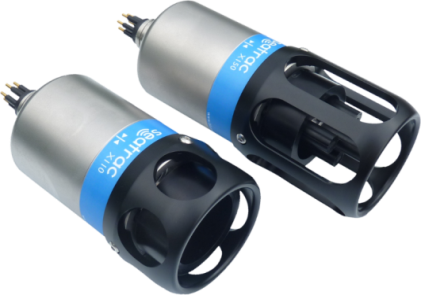
To address challenges with the large size, low bandwidth and inconsistent connection of commercially available underwater acoustic modems, a new generation of miniature acoustic modems with integrated USBL arrays were developed specifically for the project (fig T02.8). Together with efficient protocols and data compression, the CADDY system achieved reliable exchange of messages and simultaneous tracking of all agents. Specific innovations included:
- hardware development involved the design of miniature transceiver circuitry, including an extremely compact transmit amplifier and signal processing unit, and a miniature USBL receiver array with spacing of only 20mm, resulting in commercialisation of a product known as Seatrac.
- algorithm development included highly robust spread spectrum receivers, the first for a 100 bit/s frequency modulated scheme, which proved highly reliable in CADDY validation trials, and the second for a 1.4 kbit/s phase modulated scheme which achieved even higher reliability due to its adaptive processing and powerful error correction codes. USBL positioning algorithms were developed to fully reject multipath signals and guarantee reliable phase measurements.
- A new automated calibration procedure was the developed for the USBL arrays, resulting in accuracy for such a tiny array (< 5deg in azimuth and <4deg in elevation) (Fig. TO2.9.)
|
|
|
Fig. TO2.8. New USBL/acoustic modem housing.
|
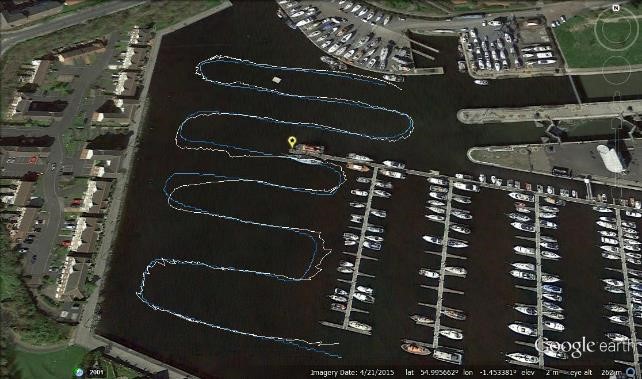
Fig. TO2.9. USBL positioning performance from calibrated Seatrac units (blue – GPS, white – USBL)
Acoustic communication scheme
The acoustic communication bandwidth limits the amount of data that can be transmitted and the mission monitoring software needed to be tailored to fit both live mission monitoring with limited data and automatic report generation using the sum of accumulated data during the mission. Apart from BUDDY vehicle telemetry data, remaining acoustic message payload had to be compressed in as little bits as possible while keeping useful data resolution and representability. Diver monitoring data transferred through the acoustic channel are as shown in table below.
|
Transferred data
|
Size (bits)
|
Description
|
|
Diver depth
|
7
|
Obtained from the pressure sensor integrated in the acoustic modem
|
|
Average flipper rate
|
4
|
Rate calculated on the diver tablet using DiverNet inertial sensors mounted on diver flippers
|
|
Heart rate
|
8
|
Obtained from commercially available Polar heart rate sensor integrated with DiverNet; measured in heart beats per minute
|
|
Breathing rate
|
7
|
Obtained from Nerites system integrated with DiverNet; measured in breaths per minute
|
|
Motion rate
|
2
|
Calculated on the diver tablet using the combination of inertial sensor measurements from DiverNet; values displayed are “low”, “medium”, “high”
|
|
PAD space
|
5
|
Diver state in the pleasure-arousal-dominance space, represented with three values
|
|
Diver state alarms
|
3
|
Displays alarms if measured or calculated values (breathing rate, heart rate and flipping difference) cross the threshold
|
|
Predefined chat
|
5
|
Codes for predefined chat messages
|
Software for diver monitoring and mission analysis
Software package was designed to allow live mission motoring and mission replay in greater detail. This package allows live mission monitoring with lower update rate due to the acoustic channel and log merging from all participants for mission replay and analysis best detail possible.
Diver monitoring and interaction:
Graphic interface software displaying diver data is called Diver State Monitor and is shown in Fig. TO2.10. This small factor GUI that shows the supervisor real time diver status using several critical values like: heart rate, breathing rate, paddling rate, motion rate, calculated PAD space. These values are calculated by the diver underwater tablet and transmitted periodically through acoustic messaging. There are three alarms sent through acoustic messaging: breathing rate, heart rate, flipping difference.
Another software instance was developed to communicate with the diver. This GUI intuitive way for the operator to issue commands to the diver, request tasks and check the diver status. Chat GUI was developed as an RQT plugin and it can be run on any machine with ROS installed. In Fig. TO2.10. Chat GUI is shown inside the RQT scope adjacent to the Diver State Monitor together making a more powerful diver monitoring and interaction tool.
Communication is enabled using a predefined set of messages such as “Are you OK?”, “OK”, “Repeat instruction”, “Dive out”, “Normal operation”, “Breathe faster”, “Issue alarm”, etc. Messages are predefined to minimize bandwidth use whilst maintaining surface-diver communication as broad as possible and covering all relevant information the diver can transmit in any given situation.
|
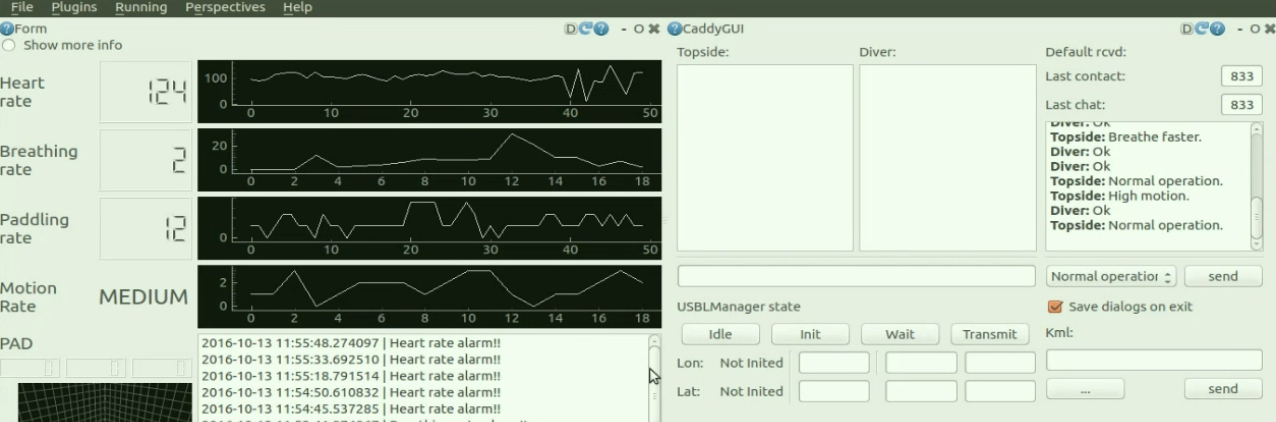
TO2.10. Chat and Diver State Monitor combined
|
Diver tablet application:
The diver tablet logs both raw data received from the DiverNet sensors and the processed data it uses to provide real-time information to the diver and later acoustically transmits to the other agents in the system and finally the surface station. All logs can be fetched from the surface station once the diver has surfaced and the tablet has automatically reconnected to a Wi-Fi network. The logs are then processed and converted to ROS-compatible and replayable bag files making them ready for use with the mission replay software.
The tablet itself carries out the gathering and pre-processing of the DiverNet sensor data:
- Heart rate is calculated by extrapolating from the recorded periods between positive pulses from the digital sensor on the diver’s torso.
- Breathing rate is calculated using a simple falling edge detection algorithm applied to the readings from the pressure sensor included in the DiverNet – the periods between subsequent pressure drops are used.
- Paddling rates for both flippers are calculated by applying a FFT to the accelerometer measurements of the DiverNet nodes placed on the diver’s feet. If there is a difference between the left and right flipper higher than a pre-set threshold, the tablet reports an alarm to the surface - the assumption being that one of the sensors on the flippers might have fallen off, or the diver is experiencing difficulties.
- Diver motion rate is calculated by applying a similar FFT algorithm to readings from the DiverNet nodes placed on the hands, feet, and head of the diver and calculating an average, then thresholding this measurement to report motion rate as a simple measure of 0 - No Motion, 1 - Low Motion, 2 - Medium Motion, and 3 - High Motion.
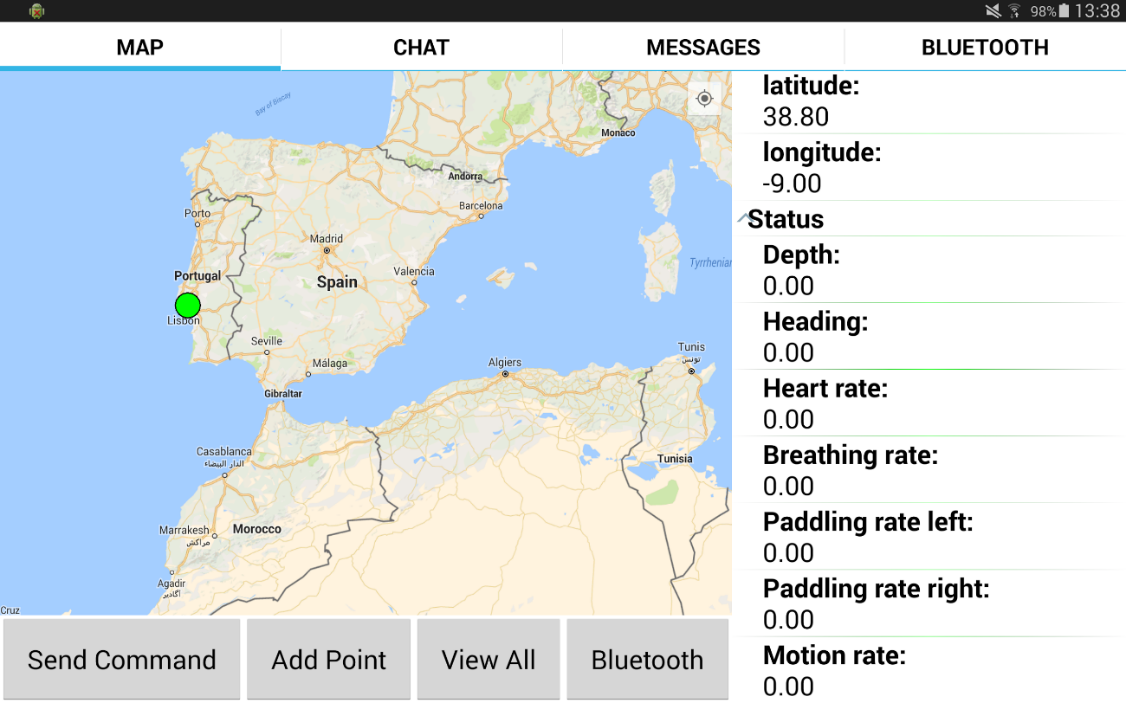
TO2.11. Example view of the diver tablet display
Mission replay
Main difficulty in logging information from multiple robots during a mission is timestamp synchronization. In ROS it is possible to log all data on some centralized location when Ethernet or Wi-Fi communication is available, however that puts a lot of strain on communication channel. Furthermore, in underwater robotics the only mean of communication is over acoustic channel which is not suitable for such information exchange. Due to that, every vehicle logs its own data aboard its own CPU and these logs are then merged together in post processing. This data can be used to generate plots and statistics from within MATLAB. However, a more visual insight is preferred for data replay as part of the generated report. By visualization more information is presented to the user analysing the report than is the case with plots and statistics. For visualization two approaches where analysed: 1) The rqt_bag approach combines plots and imaging data with a classical timeline capability; and 2) The UnderWater SIMulator (UWSIM) provides a complete 3D replay of all agent movements. Note that combining both approaches provides 1D, 2D and 3D representations of the available data.
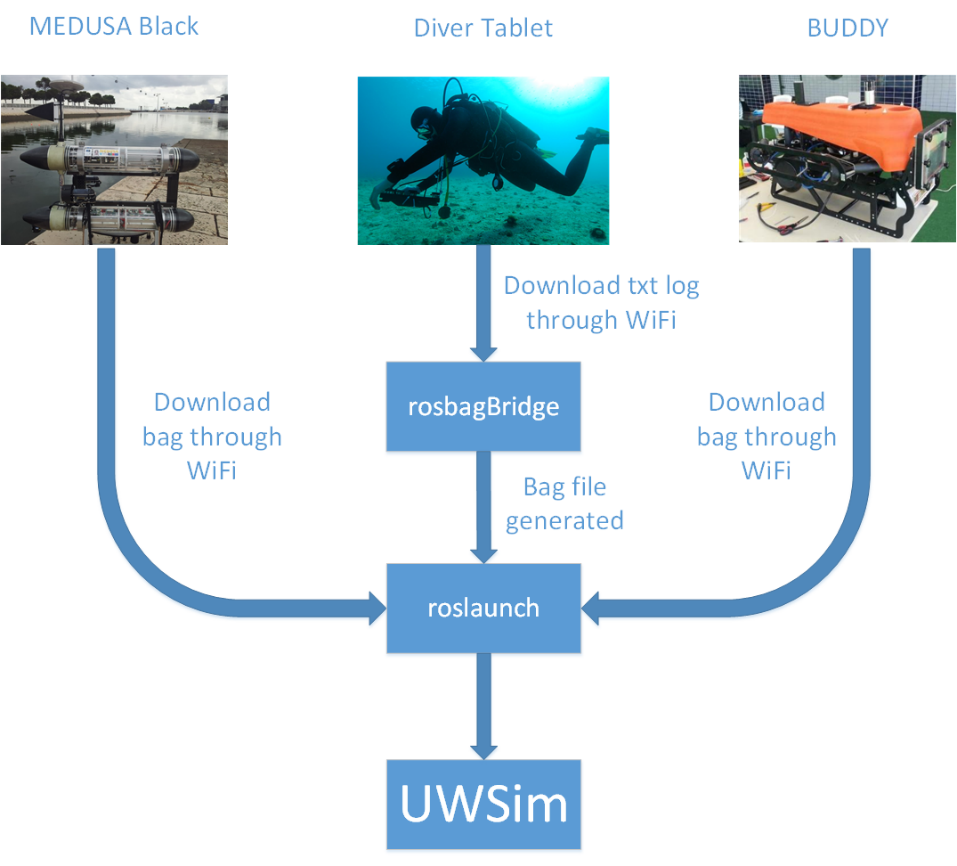 |
Fig. TO2.12. Data acquisition diagram. Just after the end of a mission, it is useful to replay the mission data in the console so that one can have a global picture of the success of the mission. To achieve this, the first step is to download the data from the diver tablet and both robotic vehicle, surface and underwater.
TO2.c. Adaptive learning mechanism for communications scheduling based on the detection of bubble produced by the driver.
To maximise acoustic communication reliability, investigations have been carried out into how transmissions may be time synchronised with the diver’s breathing pattern in order to minimise the effects of noise from the breathing apparatus. Figure TO2.13. shows a sample of the acoustic emissions measured on a CADDY project wearing a hydrophone and breathing normally. The spectrogram view (vertical axis – frequency, horizontal axis – elapsed time, colour – intensity) shows the inhalation of the diver is characterised by a continuous, high intensity, broadband emission of sound, associated with the flow of high velocity air through the regulator, which overlaps with typical acoustic modem frequencies between 10-40 kHz. This coincides with the drop in pressure observed on the intermediate pressure sensor (where installed) and so timing can easily be extracted from the DiverNet data. This can also be identified by simple processing of the total in-band noise level on the Seatrac modems (which is an existing diagnostic feature) although this may also detect other dominant noise sources such as vehicle thrusters or other acoustic devices. The exhalation results in a more impulsive set of signals resulting from the bubble plume, with most energy concentrated below acoustic modem frequencies.
Analysis shows that the most likely loss of acoustic data packets occurs when the Diver end modem is receiving a packet during the inhalation phase and hence suffers degraded SNR. This makes algorithms to synchronise transmissions with the optimum point in the breathing cycle very challenging, since it is the timing of transmissions from the other segments to the diver which must be controlled according to conditions which may only be reliably sensed at the diver segment. The acoustic interrogation scheme must be adapted to synchronise transmissions to the diver, with the proposed algorithm outlined by figure TO2.14.
.png)
Fig. TO2.13. Acoustic emission monitoring for diver breathing pattern
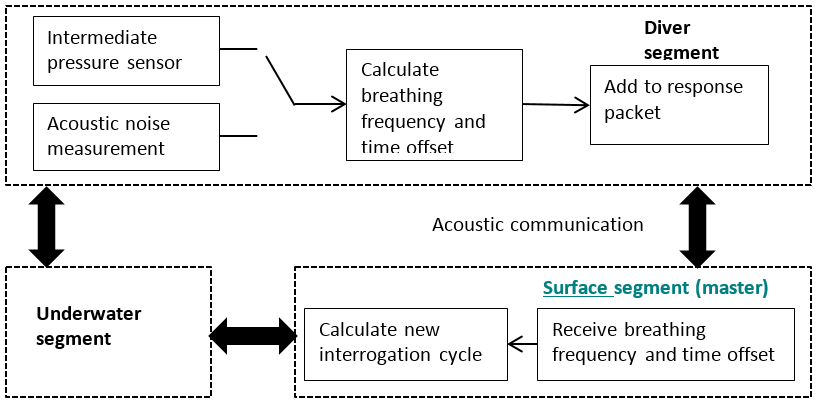
Fig. TO2.14. Scheme for acoustic communications synchronisation with diver breathing
The diver segment uses either the pressure sensor or the acoustic noise measurement to detect the diver’s inhalation and from this calculates the current breathing cycle period and a timing offset, relative to the last received packet, to guarantee that the next packet is received during the lowest noise. The surface segment (master) receives this information on each cycle, and calculates the required interrogation cycle time and offset to synchronise with the diver. This algorithm will be limited if the diver breathing period goes significantly below the minimum interrogation cycle time, though with the higher data rate mode of the modems this cycle time will be <1.5s. Time didn’t permit this scheme to be fully tested during the 2nd validation trials but it is expected to deliver measurable improvement in packet delivery to the diver modem, with gains emphasised as the distance between units increases (and so “near-end” interference becomes more significant).